The curious case of the missing natural gas imports
Strange things afoot in the EU natural gas import statistics
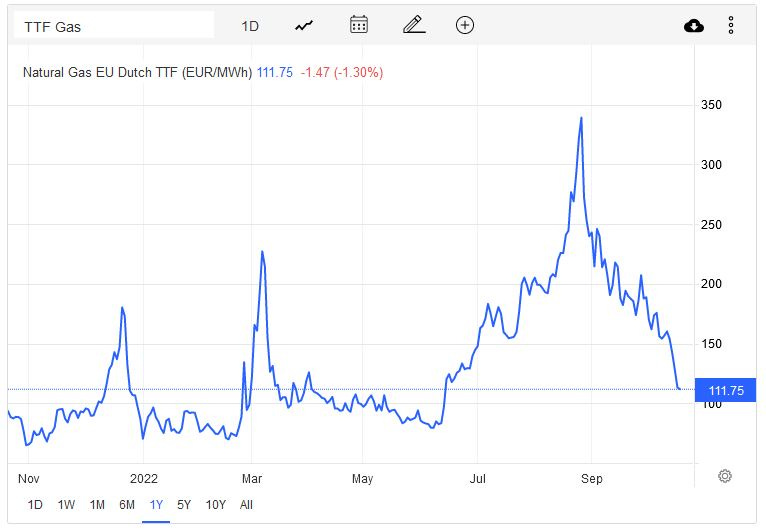
European gas prices are back down to normal. At least, that is what the market for gas futures would have you believe. Check out the round trip this market has done in recent days.
I hate the futures market and wish it would have never caught headlines. Futures markets always catch headlines because they are so volatile. Actual energy prices — for end consumers — move slowly, even in a crisis. But futures markets go haywire overnight; great for headlines.
Futures markets are speculative prices. They are not the current market price of energy. Rather, they are the market price on what the market thinks the price of energy will be in the future. If you tell the futures market a scary story and convince them to believe it, prices will spike. If you tell them a calming story and convince them to believe it, prices will fall. There has been plenty of the latter since early-September.
In this post, I am not going to engage in speculation about the future of the European natural gas markets. The futures traders do that and their opinions produce a tidy chart. Rather I am going to look what the current data is telling is.
But before looking at the data, it is worth highlighting an unusual discrepency in the data. I cannot explain this discrepency, but it is odd and I think it is worth noting. The data is from the Brugel website and from what I can tell it is not addressed anywhere on the site.
The data on European gas imports is broken down into component countries/products to show where the gas is coming from. These components are: Russia, Norway, Algeria and LNG. The data also includes a ‘total’ measure. Here’s the things: if you add the components together it does not perfectly match the total. Here is the total and the total derived from the components for 2021, for example.
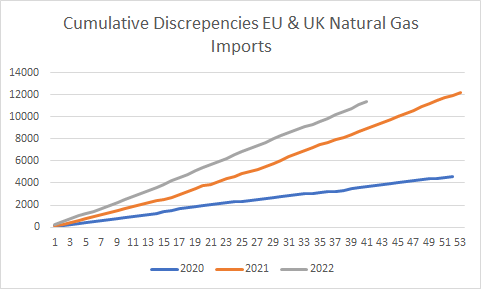
Such discrepencies are not unusual in data. But if they change drastically from year to year they become problematic. Low and behold, these discrepencies started to increase substantially in 2021 and have become even larger in 2022. Here are the cumulative totals since 2020.
That is a lot of gas that apparently came from no country in particular being added to the total!
What is going on in these statistics? I do not know. But given that we face a potential crisis this winter, it would be interesting to know what this discrepency is all about.
Now, onto the statistics themselves. First off, total imports.
As we can see here, it looks like 2022 imports have until recently been keeping pace with previous years. Although, since week 33 they have been missing the mark slightly.
The Russian import data shows why. The total figures start missing the mark when Russian gas flows hit zero.
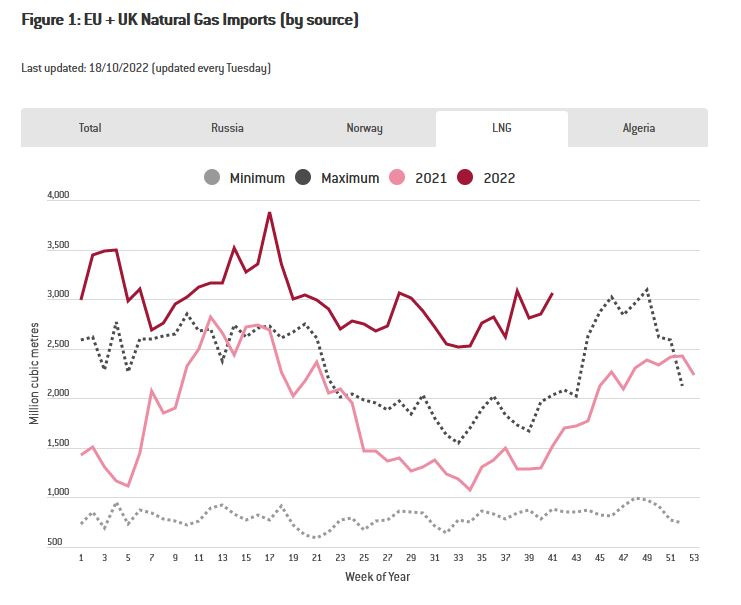
The Russian chart also shows the story of the countersanctions and the halting of Russian gas flows. These have been replaced with LNG imports which are shown in the next chart.
So, how are things looking in the European gas market? Are things as rosy as the speculators in the futures market are saying? I would say: no.
Two points are worth highlighting. The first is that we are about to go into a heavy import phase. Go back and look at the chart of total imports. Here you see that between week 21 and week 37, imports slow. But after this imports pick up. We are just now entering the phase where imports have to pick up enormously.
This feeds into the second point. That slight discrepency we see after week 33 between 2021 imports and 2022 that is caused by Russian imports hitting basically zero may not bode well for future imports. That discrepency could well start to grow as we enter the phase of heavy imports but without Russia as a key source.
One final point. LNG is not a free lunch. It costs around 40% more than the piped alternative. The chart below shows LNG imports as a percent of total imports.
Clearly we are importing a lot more LNG. This ratchets up the gas price mechanically. No need for shortages. Now go back to the futures chart. Futures prices are falling to pre-war levels. This in spite of LNG making up twice as much of gas imports and being 40% more expensive.
The lesson? Don’t listen to futures markets.


LNG sounds hyrdocarbon-heavy. Presumably petrol. All the same I'm wondering:
Could the price of gas go up... as the price of gas goes up?
Can't explain the gap you point out, but maybe futures are falling because storage for gas of all types is now full and no one can take actual delivery, at least for the next few weeks.